
The band WhiteSnake said it best. Here I go again. Football is often described as a game of inches, where being off by even one can determine the difference between victory and defeat in a league with limited opportunities. The unique shape of the football itself introduces a degree of unpredictability, influencing situations like field position during punts or the way the ball spins during field goals. Additionally, randomness plays a role in the timing of points scored, which can impact a team’s final win-loss record. Let’s face it, luck often becomes a deciding factor in the football season, and the best teams don’t always beat the worst ones. Take September 15th of last year, for example, when the Raiders defeated the Ravens 26-23. How does this happen?
As NFL analysts and sports bettors, we strive to develop reliable methods to predict next year’s football outcomes with greater accuracy. While wins and losses provide a glimpse, they rarely offer the full picture or serve as solid indicators of a team’s future success. By identifying scientific approaches that correlate past performance with future outcomes, we not only deepen our understanding but also enhance our profitability. Today, we’ll explore the 2024 Pythagorean win total calculation as a predictive tool for the 2025 NFL season.
Can an NFL team outscore its opponents and still finish with a losing record? Or score fewer points than it allows yet end up with a winning record? Surprisingly, both scenarios are entirely possible and occur annually. In 2019, for instance, the Houston Texans scored 378 points but allowed 399, managing to win 10 games. Meanwhile, the Chargers scored 337 points, narrowly conceding 345, yet only secured five victories.
Teams often rack up points in blowouts, only to lose tightly contested games—a phenomenon that highlights the need to evaluate their performance beyond the surface level. By analyzing data points such as total points scored and total points allowed, we gain a more accurate understanding of a team’s expected performance compared to its actual results. This approach, known as the Pythagorean win total method, helps us uncover discrepancies and project realistic expectations for the next season.
According to the 2011 edition of Football Outsiders Almanac, “From 1988 through 2004, 11 of 16 Super Bowls were won by the team leading the NFL in Pythagorean wins, while only seven were claimed by the team with the most actual victories.” The statistical significance of the Pythagorean wins theorem has persisted ever since.
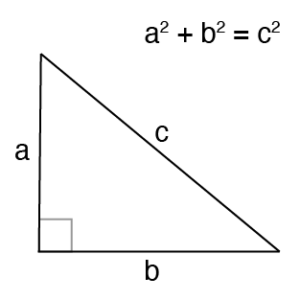
The Pythagorean theorem, expressed as a^2 + b^2 = c^2, calculates the hypotenuse of a right triangle (c) or, for our purposes, the expected relationship between its sides. Imagine points scored as (a) and points allowed as (b), where (c) is derived from the relationship between aa and (b) using their squared values. By understanding the ratio a^2/c^2 (c^2 is a^2 + b^2), we can predict the percentage of games won, multiplied by the total number of games. Using a diagram, if the triangle appears tall and thin, it signifies a team scoring significantly more points than it allows. Conversely, a short and long triangle highlights a team giving up far more points than it scores.
You might wonder—why not simply use points scored divided by total points as the basis for predictions? The answer is straightforward: it wouldn’t provide accurate results. For instance, if a team scores 75% of the total points and allows just 25%, would you expect them to win 75% of their games? Absolutely not. That level of performance—like averaging 30 points per game offensively while allowing just 10 points defensively—would suggest an even higher winning percentage. Case in point: the 16-0 New England Patriots of 2007. They scored 68.3% of the total points (averaging 36.8 on offense while giving up 17.1 on defense) and far exceeded 12 wins. Their Pythagorean win total, at 13.76, aligns much more closely with their exceptional season.
But wait—there’s more to consider. The Pythagorean equation has limitations if adjustments aren’t made. It tends to bunch teams toward the middle, even when actual outcomes deviate more dramatically from the mean. To account for these variations, adjustments must reflect the specific nuances of each sport—and in this case, football. Aaron Schatz of Football Outsiders takes this concept further, suggesting that each team’s exponent should vary based on their points scored.
According to Aaron Schatz of football outsiders, the formula for each team’s exponent that works best in the NFL is 1.5 * log ((PF+PA)/G). Much of this randomness comes from inconsistent officiating, injuries, and pure luck itself. The average exponent comes to 2.46.

One thing that I found that we can somewhat account for is turnovers. Every year there are teams that have something called turnover luck. Whether the luck is good or bad, turnovers affect the scores and the results of each game. For example, some teams could have had a 3 point field goal and instead they fumble the ball away while some defenses are put on the back of their heels when teams turn the ball over in their side of the field. Last season, the Bills had the best turnover ratio of +24 while the Browns had the worst at -22. Big shocker right? Now it is well known that turnovers are worth close to about 4 points to each team respectively and the old school way of thinking is that turnovers are mostly random, but I tend to disagree with that notion. If you look at the recent histories of each team, turnovers happen to be somewhat predictable. For example, before Tom Brady became a Tampa Bay Buccaneer, Jameis Winston used to turnover the ball quite often and it would show up significantly negative year over year in Tampa Bay’s turnover margin. Indianapolis is another team that you have been able to pencil in the negatives for a while now. On the flip side of the coin, there are teams that take care of the ball more often on a consistence basis while them ore other teams might have great ball-hocking defenses that tend to force more turnovers than the others. The Pittsburgh Steelers are definitely good with holding on to the football while the Ravens who have been dominant in that division almost always turns out positive over the last five years. Due to this, I have adjusted turnovers to be about half of what they are worth to the number from 4 to 2 points per turnover and I award or punish each team only 1 point on offense and 1 point on defense (rather than 2 and 2) with respect to their 2024 turnover ratio. Normalizing turnovers give you a better idea of what each team’s expected wins should have been based on a cleaner season. In essence, a negative turnover ratio helps those sloppier teams with better expected wins as they punish the cleaner teams that had a high positive turnover margin with lower expected wins due to the luck factor that I have applied. Even though some teams tend to take care of the ball more doesn’t mean that there isn’t some luck to the outliers and visa versa. One thing that I will add to this is that fumble luck is much less predictable than interceptions and the 2024 Raiders were an outlier here of -10 fumbles which is something that you should account for separately when predicting your 2025 numbers. Please see our chart below for our actual wins vs our Pythagorean expected win totals.
Going by this diagram we can make informed judgements and educated decisions on the actual strength of these teams with respect to not only how well they can score against their opponents but also how well that they can defend. As you can see from the difference column between the actual results from last year’s 17 game schedule with the Pythagorean (or expected) results that we can actually see how teams have either over-achieved, or under-achieved in the 2023 season. Here are the five outliers on each side:

Over-achievers:
- Kansas City Chiefs: The zebra loving Chiefs had 9.86 expected wins compared to their 15 actual wins. A -5.14 difference. They were certainly the luckiest team in the NFL for the 2024 season, and maybe the luckiest team that I have ever tracked. The Chiefs won almost all of their one score games. Mahomes is clutch but flags and no-calls are clutcher (I made up an adverb).
- Minnesota Vikings: Somehow the Vikings always make the over or under-achievers list every single year. The Queens had had only 10.56 expected wins compared to their 14 actual wins last year. A -3.44 difference. Kevin O’Connell is such a fantastic coach, that people actually started to think that QB Sam Darnold is good! I think that the Seahawks fell for that this year.
- LA Rams: The Rams had expected wins of 7.64 compared to their 10 actual wins last year. A -2.36 difference. This is what a great coach and a great quarterback can get you. It also helps that the 49ers were a shell of themselves last season.
- Houston Texans: The Texans had expected wins of 7.94 compared to their 10 actual wins last year. A -2.06 difference. The Texans scored the same amount of total points last season as they have given up. I will say that they at least did this on a 1st place schedule and injuries. Can DeMeco Ryans keep this team afloat in the easiest division in football?
- Detroit Lions: The Lions had expected wins of 13.02 compared to their 15 actual wins last year. A -1.98 difference. So even though this team overachieved, they still statistically had the most Pythagorean wins compared to any other team. Will the loss of OC Ben Johnson to the Bears factor in for 2025?
Best Bet: Kansas City Chiefs under 11.5 wins -110 – 1 star
Under-achievers:
- Tennessee Titans: The Titans had expected wins of 5.42 compared to their 3 actual wins last year. A +2.42 difference. Tennessee was 2-6 in one score games. They did not have a good quarterback as well all know so well, but this team choked away many games that they could have won based on their defense. Let’s see if they pick the right quarterback in this year’s draft.
- Jacksonville Jaguars: The Jags had expected wins of 6.18 compared to their pathetic 4 actual wins from last season. A +2.18 difference. The Jaguars had distain for their coach, but they do have a lot of pieces for the 2025-2026 season as their season win total is a huge 7.5. Liam Coen stays in Florida to try and fix this debacle. I think that this team quietly has a ton of upside.
- Las Vegas Raiders: The Raiders had expected wins of 8.68 compared to their 7 actual wins last year. A +1.95 difference. Really no surprise to see the Raiders on this list. A new coach, and new quarterback really adds a lot of variance to the next season. I am sure Pete Carrol will have his guys ready when facing the Seahawks.
- NY Giants: The G-men had expected wins of 4.94 compared to their 3 actual wins from last season. At least this team was still statistically better than the Panthers. I chuckled some at the fan base reaction when they beat the Colts in week 17 to ruin their top draft pick. The good news is that there are no perfect quarterbacks in this draft anyways and Russell Wilson will try and save Tony DaBoll’s job. I do not see that happening with the rough schedule.
- New Orleans Saints: The Aint’s had expected wins of 6.93 compared to 5 adjusted wins. A +1.93 difference. This team tricked me when they stared the season off beating the Cowboys in Dallas. Little did I realize how bad Dallas actually sucked last season. Derek Carr was of course injured half way through, but as the rock band “The Who” said it best. We won’t get fooled again.

In conclusion, it should now be easier to see the randomness in football were some teams will have better records than they actually deserve, while some teams will have worse records than they actually should have achieved. Remember to take this information for what it’s worth. When predicting season wins, we also must factor in some of the less quantifiable information such as the clutch performances from quarterbacks like Josh Allen and Patrick Mahomes along with the anti-clutch performances of Aiden O’Connell and Trevor Lawrence. Strength of schedule is another data point that is less quantifiable when it comes to actual points or season wins, but equally important when determining what these teams went through, not only in the previous season, but also in what they will be facing in the near future.
Pythagorean win totals are an important indicator of the future success of NFL teams going into their 2024 season, and it should take some precedence over last year’s actual win results. The Pythagorean win total will remain a great method for your predictive analysis for next season and beyond. Should you have any questions or want a list that can be copied and pasted, please tweet me @OBKiev. Have a great NFL season and best of luck in your research.


