")

As many of us all know, football is a game of inches, and by being off just one, could be the difference between a win and a loss in a league with limited games. The shape of the football itself creates it’s own sort of randomness on circumstances such as field position during punts and how the ball spins during field goals. There is also a certain amount of randomness of “when” the points are scored that pertains to a team’s final win record. Let’s face it, there is a good amount of luck that happens within the football season the best teams do not always win against the worst teams. We can just go back to December 20th 2020 to find an easy example of that for when the Jets played the Rams.
Many of us NFL football analysts and sports bettors want to have good methods for prediction for next year’s football season in order to be more accurate. Wins and losses do not tell the whole story and they are also rarely a good indicator by itself for a team’s future success. If we find some scientific methods that will correlate well using a team’s past performances to their success in the future, it will help us become not only more knowledgeable, but it could also help us become more profitable. The method that we will be discussing today is the 2020 Pythagorean win total calculation as a method to help predict the 2021 football season results.
Is it possible for an NFL team to score more points than they give up and have a losing record? How about score less points than they allow and have a winning record? The answer to that is that it is very possible and it happens every year. In 2019 the Houston Texas scored 378 total points, yet gave up 399 to win 10 games. In that same year, the Chargers scored 337 points while only giving up 345 (almost 50/50) and only won only 5 games.

Sometimes teams score many of their points during blowouts and as luck will have it, those same teams might lose their close games. Due to these discrepancies, we need to formulate the data to find out what some of these teams were expected to do based on points scored compared to their actual win/loss results. Using a function that takes a look at the total points scored as a data point with the total points allowed is, at many times, a better indicator of a team’s future success compared to their actual record. This is why we can use a Pythagorean win total compilation to compare what was expected to happen based on points scored for all of the NFL teams, to what actually did happen in how these teams finished out their year. This way we can have a better idea on what to expect for next season. The 2011 edition of Football Outsiders Almanac states, “From 1988 through 2004, 11 of 16 Super Bowls were won by the team that led the NFL in Pythagorean wins, while only seven were won by the team with the most actual victories. Since then, the Pythagorean wins theorem has continued to be statistically significant.
The Pythagorean theorem is a^2+b^2=c^2. It basically figures out the distance between two points of a right triangle (c), or for what we are interested in, the expected value between the relationship of sides. Please see the figure.  Think of points scored as (a), and points allowed as (b) where (c) is a function of the (a and b) linear equation and we just want to know what the relationship is between a^2/c^2 (c^2 is a^2 + b^2) to get a percentage of wins multiplied by the total games. Going by the diagram, if it is a tall and thin triangle, the team scored a lot more points compared to what they have given up, and if it is a short and long triangle, the team has given up many more points compared to what they actually have scored.
I know what you are thinking. Why can’t we just use the points scored over total points as a basis for predicting the expected outcomes? The answer to that simply is that the data would be wrong. For example, if a team scores 75% of the total points and only allowed 25% of the total points throughout the year, would we only expect that team to win just 75% of their games? Heck no. That is like averaging 30 points per game on offense and only allowing 10 points per game on defense. Even the 16-0 2007 patriots who scored 68.3% of the points averaging 36.8 on offense and giving up 17.1 on defense won many more than 12 games. The 2007 Patriots’ Pythagorean win total certainly didn’t equate to winning every game, but was at 13.76, which is much higher than the 12 and a much more relatable number to their fantastic season.
But wait, there is more! This Pythagorean equation does have it’s faults if adjustments are not made to it. This equation tends to bunch all of the teams more towards the middle when actual outcomes may deviate further away from the mean. Statistician Daryl Morey found this in football among other sports and was able to develop a more statically significant exponent of 2.37 (rather than 2) as a constant for better accuracy while utilizing this equation. Without getting too far into the weeds, we must make adjustments correlated to the actual variances that happened over the years pertaining to each sport, and for this column, football itself. Aaron Schatz of Football Outsiders takes this concept even farther by stating that each team’s exponent should be different as a function of their points scored. According to Schatz, the formula for each team’s exponent that works best in the NFL is 1.5 * log ((PF+PA)/G). I myself find that using the constant exponent of 2.37 doesn’t deviate significantly enough from Morey’s exponent model with respect to the actual randomness in the sport of football itself.

Now to discuss some of the methodology for our adjustments. The simple concept is adding a 17th game to the results. In order to do that you much take 17/16 which is 1.0625 and multiply that by each team’s points scored and points against. It is basically the same thing as adding their average points scored and allowed per game back into their total. For example, Green Bay scored 509 points during the 2020 season with an average of 31.8. Add the average to the total and you have 541 points adjusted for a 17 game season. The next adjustment that we need to make is their actual wins from 2020. Now all of these numbers are fixed numbers year over year with no decimal points so we have to theoretically add back the average into the equation by multiplying their total by 1.0625. So for instance, Green Bay won 13 games last year so we must normalize it to 13.81 and the Jacksonville Jaguars won just 1 game last year and we are normalizing it to 1.06. There is no reason to reward each team equally for a 17th game.
Finally, we have to take a look at turnovers. Every year there are teams that have something called turnover luck. Weather if the luck is good or bad, turnovers affect the scores and the results of each game. For example, some teams could have had a 3 point field goal and instead they fumble the ball away while some defenses are put on the back of their heels when teams turn the ball over in their side of the field. The Tennessee Titans had the best turnover ratio of +11 and the Denver Broncos had the worst at -16. Now it is well known that turnovers are worth about 4 points to each team respectively and the old school way of thinking is that turnovers are mostly random but I tend to disagree with that notion. If you look at the recent histories of each team, turnovers happen to be somewhat predictable. For example, before Tom Brady became a Tampa Bay Buccaneer, Jameis Winston used to turnover the ball quite often and it would show up significantly negative year over year in Tampa Bay’s turnover margin. Jacksonville is another team that you have been able to pencil in the negatives for a while now. On the flip side of the coin, there are teams that take care of the ball more often on a consistence basis while them ore other teams might have great ball-hocking defenses that tend to force more turnovers than the others. The Baltimore Ravens fit that bill and the Kansas City Chiefs have been on the high positive side for turnovers for at least the last six or seven years for the most part. Due to this, I have adjusted turnovers to be about half of what they are worth to the number of 2 points per turnover and I award or punish each team only 1 point on offense and 1 point on defense (rather than 2 and 2) with respect to their 2020 turnover ratio. Normalizing turnovers give you a better idea of what each team’s expected wins should have been based on a cleaner season. Please see our chart below for our adjusted actual wins vs our Pythagorean expected wins.
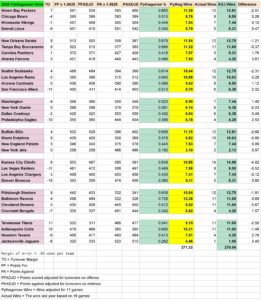
Going by this diagram we can make informed judgements and educated decisions on the actual strength of these teams with respect to not only how well they can score against their opponents but also how well that they can defend. As you can see from the difference column between the actual results adjusted for a 17 game schedule with the Pythagorean (or expected) results that we can actually see how teams have either over-achieved, or under-achieved in the 2020 season. Here are the four outliers on each side:
Over-achievers (all based on a 17 game season):
-
- Kansas City Chiefs: The Chiefs had only 10.85 expected wins compared to their 14.88 adjusted actual win record last year. A -4.02 difference. KC went 7-10-1 ATS last year and 1-9-1 ATS their last 11 games. They won a lot of close ones.
- Cleveland Browns: The Browns only had 8.02 expected wins compared to their 11.69 adjusted actual win record last year. A -3.67 difference. Cleveland was outscored 419 to 408 last year.
- Buffalo Bills: The Bills had expected wins of 11.05 compared to their 13.81 adjusted actual win record last year. A -2.66 difference. Buffalo had a pretty easy schedule but they were also ATS monsters at 12-7. Three of their four losses were were by 9 points or more and 1 of their losses was by 26 points.
- Tennessee Titans: The Titans had expected wins of 9.19 compared to their 11.69 adjusted actual win record last year. A -2.5 difference. Tennessee had +11 turnovers which really helped them win a lot of games.
Under-achievers (all based on a 17 game season):
-
-
- Atlanta Falcons: The Falcon’s had expected wins of 7.92 compared to their 4.25 adjusted actual win record last year. A +3.67 difference. Atlanta lost eight out of the nine games that were decided by a touchdown or less.
- Jacksonville Jaguars: The Jaguars had expected wins of 4.46 compared to their 1.06 adjusted actual win record last year. A +3.40 difference. An -8 turnover margin certainly didn’t help and they lost every close game that they had. Going 7-9 ATS also shows that they underachieved.
- Houston Texans: The Texans had expected wins of 7.01 compared to their 4.25 adjusted actual win record last year. A +2.76 difference. Having a -9 turnover ratio hurts while this team was predicted to regress from their Pythagorean expected win totals from 2019. Houston blew a lot of games right at the end.
- Philadelphia Eagles: The Eagles had expected wins of 6.78 compared to their 4.25 adjusted win record last year. A +2.53 difference. Philadelphia had lots of injury woes last year. They went 3-5-1 in games decided by a touchdown or less and the tie game with Cincinnati also hurt their total wins.

-
In conclusion, it should now be easier to see the randomness in football were some teams will have better records than they actually deserve, while some teams will have worse records than they actually should have achieved. Remember to take this information for what it’s worth. When predicting season wins, we also must factor in some of the less quantifiable information such as the clutch performances from quarterbacks like Tom Brady and Patrick Mahomes along with the anti-clutch performances of Cam Newton and Kirk Cousins. Strength of schedule is another data point that is less quantifiable when it comes to actual points or season wins, but equally important when determining what these teams went through, not only in the previous season, but also in what they will be facing in the near future.
Pythagorean win totals are an important indicator of the future success of NFL teams going into their 2021 seasons and it should take some precedence over last year’s actual win results. The Pythagorean win total will remain a great method for your predictive analysis in the 2021 season and beyond. Should you have any questions or want a list that can be copied and pasted, please tweet me @OBKiev. Have a great NFL season and best of luck in your research.
Ref 1: Football Outsiders: https://www.footballoutsiders.com/dvoa-ratings/2011/week-13-dvoa-ratings
Ref 2: Wikipedia: https://en.wikipedia.org/wiki/Pythagorean_expectation#:~:text=The%20formula%20is%20used%20with,referred%20to%20as%20Pythagorean%20wins.


