

Let’s do this again! Football is a game of inches, and by being off just one, could be the difference between a win and a loss in a league with limited games. The shape of the football itself creates it’s own sort of randomness on circumstances such as situation like field position during punts, and how the ball spins during field goals. There is also a certain amount of randomness of “when” the points are scored that pertains to a team’s final win record. Let’s face it, there is a good amount of luck that happens within the football season the best teams do not always win against the worst teams. We can just go back to October 22nd last year when the Patriots beat the Bills 29-25. What the heck happened?
Many of us NFL football analysts and sports bettors want to have good methods for prediction for next year’s football season in order to be more accurate. Wins and losses do not tell the whole story and they are also rarely a good indicator by itself for a team’s future success. If we find some scientific methods that will correlate well using a team’s past performances to their success in the future, it will help us become not only more knowledgeable, but it could also help us become more profitable. The method that we will be discussing today is the 2023 Pythagorean win total calculation as a method to help predict the 2024 football season results.
Is it possible for an NFL team to score more points than they give up, and have a losing record? How about score less points than they allow, and have a winning record? The answer to that is that it is very possible. This happens every year. In 2019 the Houston Texas scored 378 total points, yet gave up 399 to win 10 games. In that same year, the Chargers scored 337 points while only giving up 345 (almost 50/50) and only won only 5 games.

Sometimes teams score many of their points during blowouts, and as luck will have it, those same teams might lose their close games. Due to these discrepancies, we need to formulate the data to find out what some of these teams were expected to do based on points scored compared to their actual win/loss results. Using a function that takes a look at the total points scored as a data point with the total points allowed is, at many times, a better indicator of a team’s future success compared to their actual record. This is why we can use a Pythagorean win total compilation to compare what was expected to happen based on points scored for all of the NFL teams, to what actually did happen in how these teams finished out their year. This way we can have a better idea on what to expect for next season. The 2011 edition of Football Outsiders Almanac states, “From 1988 through 2004, 11 of 16 Super Bowls were won by the team that led the NFL in Pythagorean wins, while only seven were won by the team with the most actual victories. Since then, the Pythagorean wins theorem has continued to be statistically significant.
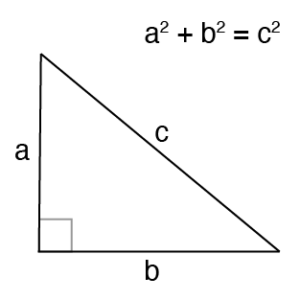
The Pythagorean theorem is a^2+b^2=c^2. It basically figures out the distance between two points of a right triangle (c), or for what we are interested in, the expected value between the relationship of sides. Please see the figure. Think of points scored as (a), and points allowed as (b) where (c) is a function of the (a and b) linear equation and we just want to know what the relationship is between a^2/c^2 (c^2 is a^2 + b^2) to get a percentage of wins multiplied by the total games. Going by the diagram, if it is a tall and thin triangle, the team scored a lot more points compared to what they have given up, and if it is a short and long triangle, the team has given up many more points compared to what they actually have scored.
I know what you are thinking. Why can’t we just use the points scored over total points as a basis for predicting the expected outcomes? The answer to that simply is that the data would be wrong. For example, if a team scores 75% of the total points and only allowed 25% of the total points throughout the year, would we only expect that team to win just 75% of their games? Heck no. That is like averaging 30 points per game on offense and only allowing 10 points per game on defense. Even the 16-0 2007 patriots who scored 68.3% of the points averaging 36.8 on offense and giving up 17.1 on defense won many more than 12 games. The 2007 Patriots’ Pythagorean win total certainly didn’t equate to winning every game, but was at 13.76, which is much higher than the 12 and a much more relatable number to their fantastic season.
But wait, there is more! This Pythagorean equation does have it’s faults if adjustments are not made to it. This equation tends to bunch all of the teams more towards the middle when actual outcomes may deviate further away from the mean. Without getting too far into the weeds, we must make adjustments to the actual variances that happened over the years pertaining to each sport, and for this column, football itself. Aaron Schatz of Football Outsiders takes this concept even farther by stating that each team’s exponent should be different as a function of their points scored. According to Aaron Schatz of football outsiders, the formula for each team’s exponent that works best in the NFL is 1.5 * log ((PF+PA)/G). Much of this randomness comes from inconsistent officiating, injuries, and pure luck itself. The average exponent comes to 2.46.

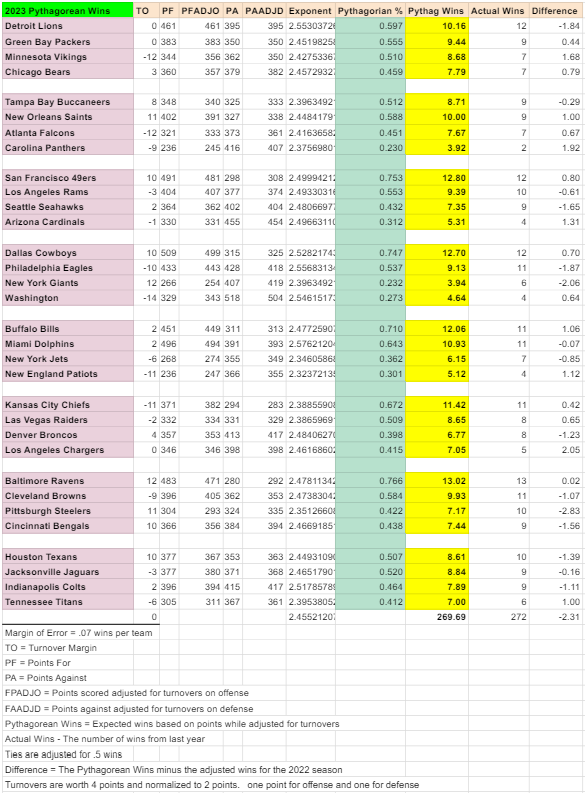
One thing that I found that we can somewhat account for is turnovers. Every year there are teams that have something called turnover luck. Whether the luck is good or bad, turnovers affect the scores and the results of each game. For example, some teams could have had a 3 point field goal and instead they fumble the ball away while some defenses are put on the back of their heels when teams turn the ball over in their side of the field. The 49ers had the best turnover ratio of +13 while the Colts had the worst at -13. Big shocker right? Now it is well known that turnovers are worth close to about 4 points to each team respectively and the old school way of thinking is that turnovers are mostly random, but I tend to disagree with that notion. If you look at the recent histories of each team, turnovers happen to be somewhat predictable. For example, before Tom Brady became a Tampa Bay Buccaneer, Jameis Winston used to turnover the ball quite often and it would show up significantly negative year over year in Tampa Bay’s turnover margin. Indianapolis is another team that you have been able to pencil in the negatives for a while now. On the flip side of the coin, there are teams that take care of the ball more often on a consistence basis while them ore other teams might have great ball-hocking defenses that tend to force more turnovers than the others. The New England Patriots fit that bill and the Bengals have been trending positive with Joe Burrow over the last few years. Due to this, I have adjusted turnovers to be about half of what they are worth to the number from 4 to 2 points per turnover and I award or punish each team only 1 point on offense and 1 point on defense (rather than 2 and 2) with respect to their 2023 turnover ratio. Normalizing turnovers give you a better idea of what each team’s expected wins should have been based on a cleaner season. In essence, a negative turnover ratio helps those sloppier teams with better expected wins as they punish the cleaner teams that had a high positive turnover margin with lower expected wins due to the luck factor that I have applied. Even though some teams tend to take care of the ball more doesn’t mean that there isn’t some luck to the outliers and visa versa. One thing that I will add to this is that fumble luck is much less predictable than interceptions and the 2023 Jets were an outlier here of -8 fumbles which is something that you should account for separately when predicting your 2024 numbers. Please see our chart below for our actual wins vs our Pythagorean expected win totals.
Going by this diagram we can make informed judgements and educated decisions on the actual strength of these teams with respect to not only how well they can score against their opponents but also how well that they can defend. As you can see from the difference column between the actual results from last year’s 17 game schedule with the Pythagorean (or expected) results that we can actually see how teams have either over-achieved, or under-achieved in the 2023 season. Here are the five outliers on each side:
Over-achievers:
- Pittsburgh Steelers: The Steelers had 7.17 expected wins compared to their 10 actual wins. A -2.83 difference. They were certainly the luckiest team in the NFL for the 2023 season. This team had a lot of fourth quarter comebacks due to their opponents choking the games away. The name the Ste(a)lers are quite accurate as they were 9-2 in one score wins.
- New York Giants: For as bad as this team was last year, they still should have been worse. The G-men had had only 3.94 expected wins compared to their 6 actual wins last year. A -2.06 difference. When this team played the good teams, they were literally blown away.
- Philadelphia Eagles: The Eagles had expected wins of 9.13 compared to their 11 actual wins last year. A -1.87 difference. This team started out on a rampage going 10-1 in their first 11 games yet only 1-6 in their final seven including their ugly playoff loss to Tampa Bay.
- Detroit Lions: The Lions had expected wins of 10.16 compared to their 12 actual wins last year. A -1.84 difference. Even though this team seemed to overachieve, they at least were the best ATS team at 14-6 over the full NFL season including playoffs. This team was underrated from the start.
- Seattle Seahawks: The Seahawks had expected wins of 7.35 compared to their 9 actual wins last year. A -1.65 difference. Regression was the big thing last year for the Sea-Chickens and they lost ground to division rival LA Rams. New coach Mike McDonald has his work cut out for him with QB Geno Smith and a whole new system. The 3-4 defensive scheme remains the same.
Best Bet: Seattle Seahawks under 7.5 wins +114 (Fanduel) – 1.5 stars
Under-achievers:
- LA Chargers: The Chargers had expected wins of 7.05 compared to their 5 actual wins last year. A +2.05 difference. The sad thing is that this team had a season win total of around 10 before opening kickoff sending coach Brandon Staley to the 49ers as a defensive coordinator. The Chargers went 6-11 ATS. The Bolts were 3-8 in one score games last season.
- Carolina Panthers: The Panthers had expected wins of 3.92 compared to their pathetic 2 actual wins last year. A +1.92 difference. This is really bad being that usually the two win team is the top under-achiever in the league. The Panthers have never led a game at the start of the fourth quarter.
- Minnesota Vikings: The Queens had expected wins of 8.68 compared to their 7 actual wins last year. A +1.68 difference. My how times have changed as their expected wins were about the same as the year before yet instead of over-achieving by over 4 wins, they under-achieved by over 1. I hope everyone cashed that plus money under 8.5 with me.
- Arizona Cardinals: The Cardinals had expected wins of 5.31 compared to their 4 actual wins last year. A +1.31 difference. The Cardinals had it tough for a while without Kyler Murray. Josh Dobbs showed some life and then went quickly goes from hero to zero like he does everywhere that he lands. It is hard to predict this team for 2024.
- New England Patriots: The Patriots had expected wins of 5.12 compared to 4 adjusted wins. A +1.12 difference. Maybe the most disappointing team in the league minus the Chargers. Many people expected more out of Bill Belichik, but poor drafting and terrible offensive coaches have really sunken this ship. I am still wondering how this team beat buffalo last year. The win at Pittsburgh was also a head scratcher. New Coach this year in Jared Mayo won’t move the needle much in my opinion.

In conclusion, it should now be easier to see the randomness in football were some teams will have better records than they actually deserve, while some teams will have worse records than they actually should have achieved. Remember to take this information for what it’s worth. When predicting season wins, we also must factor in some of the less quantifiable information such as the clutch performances from quarterbacks like Josh Allen and Patrick Mahomes along with the anti-clutch performances of Will Levis and Justin Fields. Strength of schedule is another data point that is less quantifiable when it comes to actual points or season wins, but equally important when determining what these teams went through, not only in the previous season, but also in what they will be facing in the near future.
Pythagorean win totals are an important indicator of the future success of NFL teams going into their 2024 season, and it should take some precedence over last year’s actual win results. The Pythagorean win total will remain a great method for your predictive analysis for next season and beyond. Should you have any questions or want a list that can be copied and pasted, please tweet me @OBKiev. Have a great NFL season and best of luck in your research.


